
This archive contains answers to questions sent to Unidata support through mid-2025. Note that the archive is no longer being updated. We provide the archive for reference; many of the answers presented here remain technically correct, even if somewhat outdated. For the most up-to-date information on the use of NSF Unidata software and data services, please consult the Software Documentation first.
Hello! Thanks for reaching out to us and your patience in the mean-time.
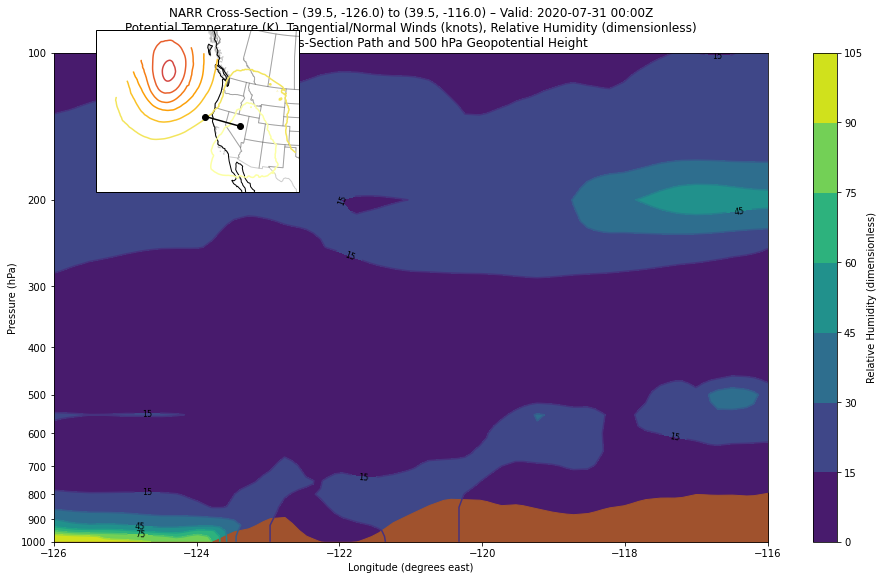
I was able to create a (admittedly rough) version of this from your provided
GFS .nc file that I've attached. You're close! The only thing I needed to
change was to clean up the units on the input pressure and to specify the
1000-hPa limit as an xarray DataArray. I did this instead of your manual
conversion, and then specified the scalar 1000-hPa value as a DataArray using
the 'plevel' coordinate variable. The provided data file had what appeared to
be an erroneous 18000-hPa I also needed to remove first. So, all-in-all I have
this code leading up to the plotting cell:
# This selects everything but your final 18000-hPa plevel value
data = data.isel(plevel=slice(0, -1))
start = (39.5, -126.0)
end = (39.5, -116.0)
cross = cross_section(data, start, end)
temperature, pressure = xr.broadcast(cross['TMP'], cross['plevel'])
theta = mpcalc.potential_temperature(pressure, temperature)
cross['Potential_temperature'] = xr.DataArray(theta,
coords=temperature.coords,
dims=temperature.dims,
attrs={'units': theta.units})
cross['UGRD'].metpy.convert_units('knots')
cross['VGRD'].metpy.convert_units('knots')
cross['t_wind'], cross['n_wind'] =
mpcalc.cross_section_components(cross['UGRD'], cross['VGRD'])
cross['PRES_surface'].metpy.convert_units('hPa')
and then finally adding in the line nearly as you have it in the plotting cell:
ax.fill_between(cross['longitude'], cross['plevel'].sel(plevel=1000),
cross['PRES_surface'], color='sienna')
With that, you can see the result I achieved attached. For your second
question, our `cross_section` code interpolates along a geodesic line between
the provided latitudes and longitudes. So, if you plot on the flat PlateCarree
projection, the line will appear curved. I plotted here with a LambertConformal
projection as my `data_crs` to represent the line closer to the example on the
documentation. Remember to transform the inset contours as well!
I hope this gives you something to work with and at least points you in the
right direction. If there's any further way I can help or perhaps put together
a more thorough demonstration, don't hesitate to follow up! I appreciate your
patience, and thanks again for reaching out to us.
All the best,
Drew
> Two Quick questions...I think. I took this example metpy cross section
> code and verified that it worked for me:
> https://unidata.github.io/MetPy/latest/examples/cross_section.html
>
> Then I edited a version to work with GFS data, with different labels and
> such and this generally worked! (after fiddling with units and a few
> details)
>
> 1) I'd like to add the surface terrain as interpreted by surface pressure,
> which would look something like this for example:
>
> ( I can't use the code that produced this because it uses a completely
> different custom methodology that I don't understand, not to mention
> different input data format, and I want to transition to metpy standards)
>
> Here is my new GFS python code:
>
>
> And here is the GFS netcdf file that is used for plotting:
>
> On lines 102-103 of my code I have some logic to show what I think I need
> to do, but which I know is flawed.
>
> *# color terrain - NEEDS WORK#
> ax.fill_between(cross['longitude'[0],cross['PRES_surface']*.01,1000.,color='sienna',zorder=10)*
>
> I know I want to "fill_between" the min pressure (1000 or so) and the
> "PRES_surface" at the lat/lon point in the cross section, but I'm
> struggling with how to do this. I do have "PRES_surface" data as a 2D
> array in my "data".
> Any suggestions how I might go about doing this?
>
> 2) I think this is easier. I haven't been able to get my inset plot to
> have a proper projection, and notice the path of cross section is curved a
> bit.
> Any tips to fix that?
>
Ticket Details
===================
Ticket ID: LNM-931708
Department: Support Python
Priority: Low
Status: Closed
===================
NOTE: All email exchanges with Unidata User Support are recorded in the Unidata
inquiry tracking system and then made publicly available through the web. If
you do not want to have your interactions made available in this way, you must
let us know in each email you send to us.
Attachment:
index.png
Description: PNG image