
This archive contains answers to questions sent to Unidata support through mid-2025. Note that the archive is no longer being updated. We provide the archive for reference; many of the answers presented here remain technically correct, even if somewhat outdated. For the most up-to-date information on the use of NSF Unidata software and data services, please consult the Software Documentation first.
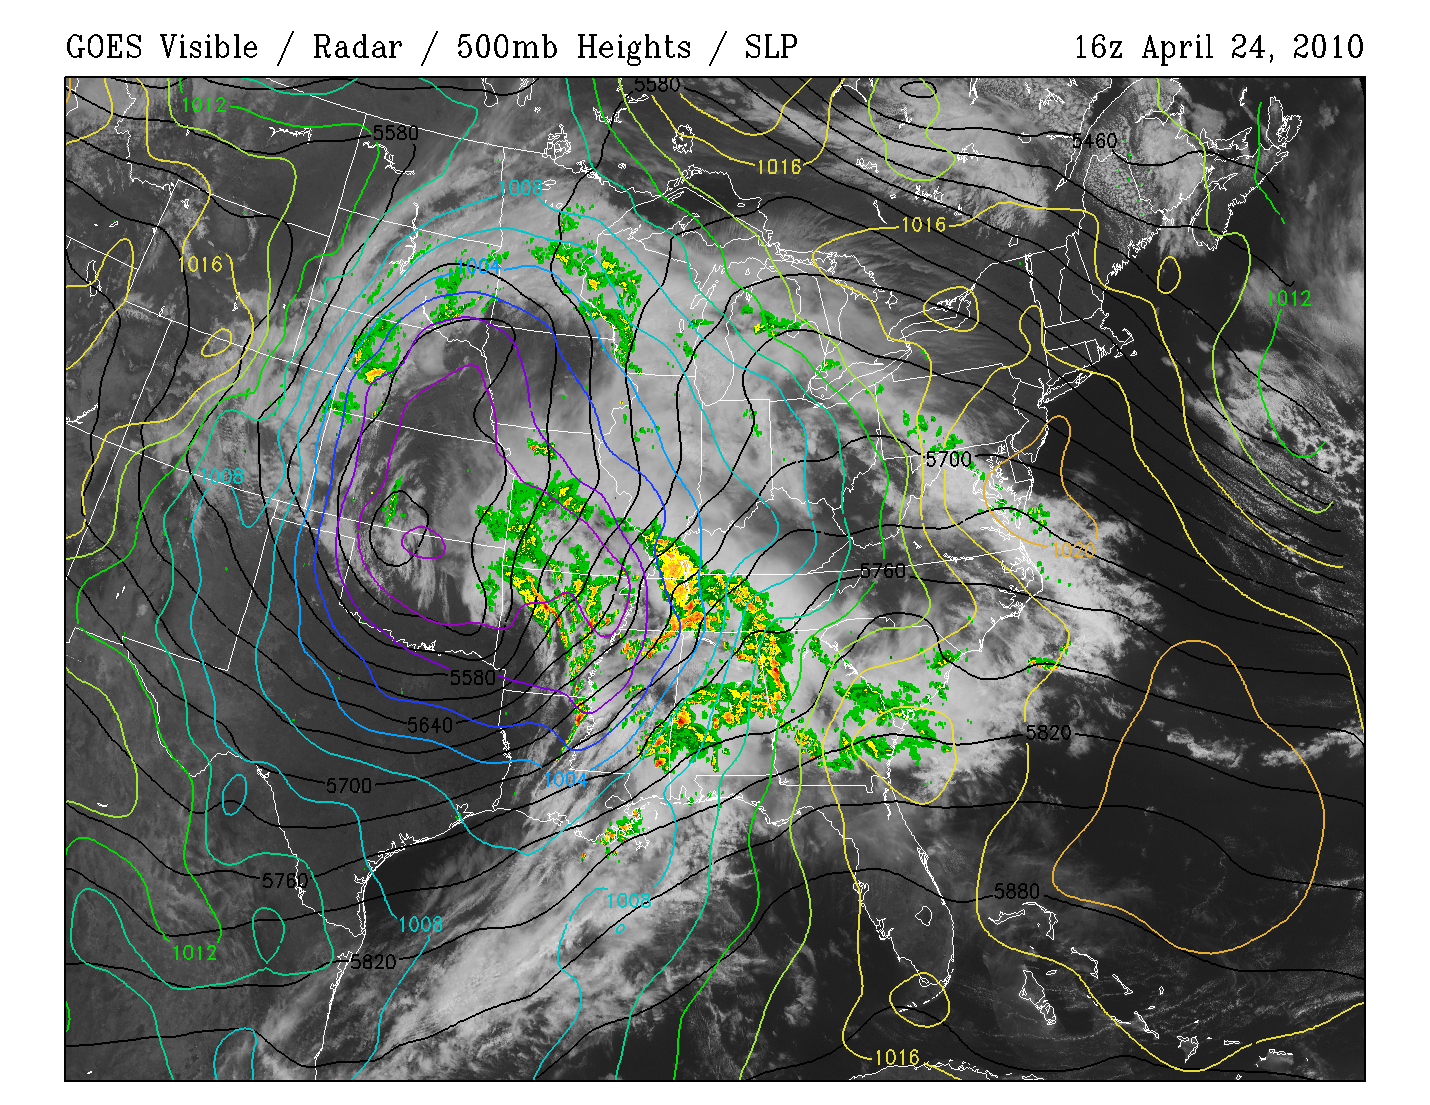
Hi Brian,

re:
> Hello, I have not heard anything regarding this issue since I reported it?

I apologize for the silence.  We are right in the middle of hosting training
workshops for the packages we offer, so we are very short on time.  A bad
excuse, but unfortunately reality (sigh)...

re:
> I suppose the timing is never good for these sorts of things, but we are
> right at the point in the synoptic class where we discuss radar.  And we
> have all too few east coast storms during the fall semester, and this outage
> has extended right through the current anomalous east coast troughing
> event.
>
> Can you let me know what the status of this is?  Are there other similar
> data products available?  ie a geo-registered radar data product that is
> fairly high resolution (both time and space) that is provided in a standard
> (or at least documented) data format in near real time?

Status:  the creation of the GRIB2 version of the composite imagery have been
restored to the FNEXRAD feed as of 15:36 MT.  Please let me know that you are
receiving the data you need now.

FYI: the tricky part in figuring out what broke was the fact that the
GINI image version of the products continued to be created and distributed
in the FNEXRAD feed.

re:
> This data is extremely useful for motivating class discussions on
> mid-latitude synoptic systems.  Since the data is geo-registered, it is easy
> to overlay the data with other meteorological variables such as surface data
> (Eg: http://wx.gmu.edu/dev/chisym.00z24jun09.png ) so that the precipitation
> patterns can be compared with surface features such as fronts, lows, highs,
> wind flow patterns, etc. Or overlaying it with upper air data (Eg:
> http://wx.gmu.edu/dev/vis500-2010042416.png ) where the precipitation and
> cloud pattern can be compared with the shape and movement of the upper
> trough and can also be compared with the placement and structure of the
> upper jets.  Or for making animations (Eg: http://wx.gmu.edu/dev/radar.mov )
> where the time evolution of a system can be viewed in detail and compared
> with the evolution of other variables.  I would have real time examples of
> such comparisons for the current east coast system -- but the radar data is
> not coming in.

Thanks for describing how you use the data!

re:
> Anyway, I am now scouring the web to try to find alternatives, since I have
> not heard from you and the class is proceeding regardless.  Any help you may
> be able to provide would be appreciated...

The data is flowing again, so you should be able to take advantage of them
in your established workflow.

Again, I apologize for the interruption in service!

Cheers,

Tom
--
****************************************************************************
Unidata User Support                                    UCAR Unidata Program
(303) 497-8642                                                 P.O. Box 3000
address@hidden                                   Boulder, CO 80307
----------------------------------------------------------------------------
Unidata HomePage                       http://www.unidata.ucar.edu
****************************************************************************


Ticket Details
===================
Ticket ID: WXQ-924153
Department: Support IDD
Priority: Normal
Status: Closed